Analyzing sales data is crucial for making informed business decisions. In today’s competitive marketplace, understanding consumer behavior, identifying trends, and optimizing sales strategies can significantly impact a company’s success.
By delving into detailed sales metrics, businesses can uncover valuable insights that drive growth, improve customer satisfaction, and enhance profitability. This article will guide you through the process of effectively analyzing sales data, from gathering and organizing information to interpreting results and implementing actionable strategies.
Whether you are a small business owner or a seasoned executive, mastering these skills is essential for navigating the ever-evolving business landscape.
Analyze Sales Data and Make Informed Decisions
Analyzing sales data is a critical process in modern business management. It involves the systematic examination of sales figures, customer behavior, and market trends to identify patterns, opportunities, and areas for improvement.
By making informed decisions based on this analysis, companies can optimize their sales strategies, improve customer satisfaction, and ultimately drive revenue growth.
Importance of Sales Data Analysis
Sales data analysis is essential for making strategic decisions in business. It helps companies understand customer preferences, identify high-performing products, and detect potential issues before they become major problems.
By leveraging analytics tools, businesses can gain insights into market dynamics, enabling them to tailor their marketing efforts and sales tactics to better meet customer needs and stay ahead of the competition.
Key Metrics to Track in Sales Data Analysis
To effectively analyze sales data, it is crucial to track several key metrics. These include revenue, sales volume, customer acquisition cost, customer lifetime value, and conversion rates.
By monitoring these metrics, businesses can gain a comprehensive view of their sales performance and make data-driven decisions to optimize their sales processes and marketing strategies. Regularly reviewing these metrics also helps in identifying trends and making timely adjustments to maintain or improve performance.
Using Data Visualization to Enhance Analysis
Data visualization is a powerful tool for enhancing sales data analysis. Visual representations such as charts and graphs make it easier to understand complex data sets and identify trends at a glance.
By using visual aids, businesses can communicate insights more effectively to stakeholders and make informed decisions more quickly. Tools like Microsoft Excel, Tableau, and Power BI are popular choices for creating dynamic and interactive visualizations that provide a clear picture of sales performance.
| Key Metric | Description |
|---|---|
| Revenue | Total income generated from sales |
| Sales Volume | Total number of units sold |
| Customer Acquisition Cost | Cost associated with acquiring a new customer |
| Customer Lifetime Value | Projected value of a customer over the entire relationship |
| Conversion Rates | Percentage of potential customers who make a purchase |
What are the 5 step processes in analyzing the data?
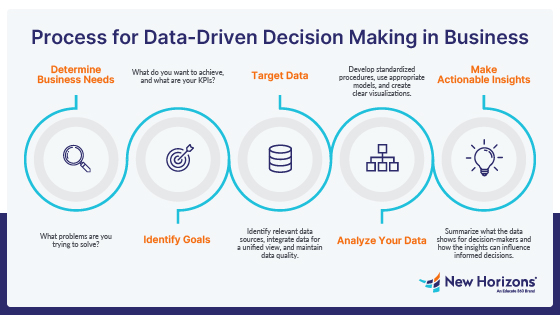
The five-step process in analyzing data is a structured approach that helps ensure thorough and effective data analysis. These steps are crucial for making informed decisions based on the data. Here are the detailed steps:
1. Define the Question or Objective: The first step involves clearly defining the question or the objective of the data analysis. This step is critical as it sets the foundation for the entire analysis. It helps in identifying what specific information is needed and what the primary goals are. This clarity ensures that the subsequent steps are aligned with the intended outcomes.
2. Data Collection: In this step, the relevant data is gathered from various sources. The quality and relevance of the data collected are crucial for the accuracy of the analysis. Data can be collected through surveys, experiments, databases, or other means. It is important to ensure that the data is comprehensive and representative of the population or phenomenon being studied.
3. Data Preparation: Once the data is collected, it must be cleaned and prepared for analysis. This step involves handling missing values, removing duplicates, and correcting errors. Data preparation also includes transforming the data into a format that is suitable for analysis. This may involve normalizing data, encoding categorical variables, and creating new variables through feature engineering.
4. Data Analysis: In this step, the cleaned and prepared data is analyzed to extract meaningful insights. Various statistical and analytical techniques are applied, such as descriptive statistics, inferential statistics, regression analysis, and machine learning algorithms. The choice of techniques depends on the nature of the data and the specific questions being addressed.
5. Interpretation and Reporting: The final step involves interpreting the results of the analysis and communicating them in a clear and understandable manner. This may involve creating visualizations, writing reports, and presenting findings to stakeholders. The interpretation should be honest and should highlight both the strengths and limitations of the analysis. This step ensures that the insights derived from the data are actionable and can be used to make informed decisions.
Data Collection Techniques
Data collection is a fundamental step that requires careful planning. Here are some common techniques used in data collection:
- Surveys and Questionnaires: These are used to gather data directly from respondents. They can be conducted online, over the phone, or in person. Surveys are useful for collecting a large amount of data quickly.
- Experiments: These involve manipulating one or more variables to observe the effect on other variables. Experiments are particularly useful in establishing cause-and-effect relationships.
- Observational Studies: These involve observing and recording data without intervention. Observational studies are useful for studying behaviors and phenomena in their natural settings.
Data Preparation Best Practices
Data preparation is crucial for ensuring the quality and reliability of the analysis. Here are some best practices:
- Handle Missing Data: Missing data can be handled by imputation methods, such as mean imputation, regression imputation, or using machine learning algorithms. It is important to choose the method that best fits the data and the analysis.
- Remove Duplicates: Duplicates can skew the results of the analysis. Identifying and removing duplicates ensures that each data point is counted only once.
- Feature Engineering: Creating new features from existing data can enhance the analysis. This may involve combining variables, creating interaction terms, or transforming variables to better capture the underlying patterns.
Data Analysis Techniques
Data analysis involves applying various techniques to extract insights from the data. Here are some common techniques:
- Descriptive Statistics: These techniques summarize and describe the main features of the data. Measures such as mean, median, and standard deviation provide a clear overview of the data.
- Inferential Statistics: These techniques are used to make inferences about a population based on a sample. Hypothesis testing, confidence intervals, and regression analysis are common inferential methods.
- Machine Learning Algorithms: These algorithms learn patterns from the data and can be used for prediction, classification, and clustering. Techniques such as decision trees, random forests, and neural networks are widely used in data analysis.
What questions to ask when analyzing sales data?
When analyzing sales data, asking the right questions can help you gain valuable insights and make informed decisions. Here are some key questions to consider:
1. What is the overall sales performance?
– Understanding the total sales revenue and the number of units sold can provide a baseline for performance. This helps in identifying trends and patterns over different time periods.
- What is the total revenue for the quarter/year?
- How does this compare to the previous period?
- What is the average sale per transaction?
2. Which products or services are performing the best and the worst?
– Analyzing individual product or service performance can highlight areas of strength and weakness in your portfolio.
- Which products have the highest sales volume?
- Which products have the lowest sales volume?
- What is the profit margin for each product?
3. How do sales vary by customer segment?
– Segmenting customers can reveal which groups are driving sales and which may need more attention.
- What are the top-performing customer segments?
- What are the common characteristics of high-value customers?
- How can we better target or retain these segments?
4. What is the sales trend over time?
– Examining sales data over different time periods can help identify seasonal patterns, growth trends, and anomalies.
- Are there any seasonal spikes in sales?
- How have sales grown over the past year?
- Are there any unexpected dips or surges in sales?
5. How effective are our sales and marketing efforts?
– Evaluating the impact of sales and marketing activities can help optimize resource allocation and improve ROI.
- Which marketing campaigns have the highest conversion rates?
- What is the customer acquisition cost (CAC) for each channel?
- How do different marketing channels contribute to overall sales?
6. What are the key drivers of sales?
– Identifying the factors that influence sales can help in making strategic decisions.
- What external factors (e.g., economic conditions, competitor actions) affect sales?
- Which internal factors (e.g., pricing, promotions) have the greatest impact?
- How do customer reviews and ratings influence sales?
Understanding the Customer Base
Segmenting customers can provide deep insights into buying behaviors and preferences. By understanding different customer segments, businesses can tailor their strategies to meet specific needs and improve customer satisfaction.
- What are the demographics of our best customers?
- What are the purchasing habits of our most loyal customers?
- How can we engage and retain high-value customers more effectively?
Identifying Sales Trends and Patterns
Analyzing sales data over time can help identify trends and patterns that inform future strategies. Recognizing these trends can help in forecasting, inventory management, and resource planning.
- What are the year-over-year sales trends?
- Are there any recurring patterns in sales by month or quarter?
- How do sales patterns differ across different regions or channels?
Optimizing Marketing and Sales Efforts
Evaluating the effectiveness of marketing and sales strategies is crucial for improving ROI and driving growth. By assessing which tactics are most successful, businesses can refine their approach and allocate resources more efficiently.
- Which marketing channels have the highest ROI?
- What are the most effective sales techniques used by top-performing salespeople?
- How can we improve the alignment between marketing and sales efforts?
What does a data analyst do in sales?
A data analyst in sales plays a crucial role in enhancing business performance by providing actionable insights derived from data. They are responsible for collecting, processing, and performing statistical analyses on sales data to help the company make informed decisions.
The primary tasks of a data analyst in sales include identifying trends, patterns, and correlations that can inform sales strategies, customer behavior, and market dynamics. They also work closely with the sales team to set targets, track performance, and provide regular reports that highlight areas for improvement.
Additionally, data analysts in sales may develop predictive models to forecast future sales and identify potential risks or opportunities. Their work often involves using tools such as SQL, Excel, Tableau, and Python to manage and visualize data effectively.
Key Responsibilities in Sales Data Analysis
A data analyst in sales has several key responsibilities that are essential for the success of the sales department:
- Data Collection and Management: They gather sales data from various sources, including CRM systems, sales reports, and market research. This data is then cleaned and organized to ensure accuracy and reliability.
- Data Analysis and Reporting: Using statistical methods and data visualization tools, they analyze sales data to identify trends and patterns. Regular reports and dashboards are created to provide the sales team with clear insights and actionable recommendations.
- Performance Tracking and KPIs: Data analysts set key performance indicators (KPIs) for the sales team and track their progress. They provide feedback and suggestions for improving sales performance based on the data analysis.
Tools and Technologies Used by Sales Data Analysts
Sales data analysts rely on a variety of tools and technologies to perform their tasks effectively:
- SQL and Databases: SQL is used for querying and managing large datasets, while databases like MySQL, PostgreSQL, or Oracle are used to store and retrieve data efficiently.
- Data Visualization Tools: Tools like Tableau, Power BI, and Excel are used to create visual representations of data, making it easier for the sales team to understand complex information and trends.
- Programming Languages: Python and R are commonly used for advanced data analysis, modeling, and automation tasks. These languages offer powerful libraries and frameworks for data manipulation and statistical analysis.
Impact of Sales Data Analysis on Business Strategy
The insights provided by sales data analysts have a significant impact on business strategy:
- Customer Segmentation: By analyzing customer behavior and preferences, data analysts help the sales team segment the market and target specific customer groups more effectively.
- Predictive Analytics: Using historical data, data analysts can build predictive models to forecast future sales trends and potential risks. This helps in strategic planning and resource allocation.
- Optimizing Sales Channels: Data analysis can identify which sales channels are most effective and where efforts should be focused. This leads to more efficient use of resources and higher return on investment.
Which analytics is the practice of using data and information to make informed decisions?
The practice of using data and information to make informed decisions is known as business analytics. This field encompasses a wide range of techniques and tools that help organizations analyze historical data, understand current trends, and predict future outcomes.
Business analytics involves several key components, including data collection, data processing, statistical analysis, and visualization. By leveraging these tools, companies can gain valuable insights that drive strategic decisions, optimize operations, and enhance overall performance.
Types of Business Analytics
Business analytics can be categorized into four main types:
- Descriptive Analytics: This type of analytics focuses on understanding what has happened in the past. It involves analyzing historical data to identify patterns and trends. Common tools used in descriptive analytics include dashboards and reports.
- Diagnostic Analytics: This type of analytics delves deeper into the insights provided by descriptive analytics to understand why certain outcomes occurred. It often involves techniques such as data mining and root cause analysis.
- Predictive Analytics: Predictive analytics uses statistical models and machine learning algorithms to forecast future outcomes based on historical data. This type of analytics helps organizations anticipate trends and make proactive decisions.
- Prescriptive Analytics: This type of analytics goes a step further than predictive analytics by not only forecasting outcomes but also suggesting actions to take. It often involves optimization techniques and simulation models.
Importance of Data Quality in Business Analytics
Data quality is crucial in business analytics because it directly impacts the accuracy and reliability of the insights derived from the data. Poor data quality can lead to misleading results and poor decision-making. To ensure high data quality, organizations should:
- Data Cleansing: Regularly clean and validate data to remove errors and inconsistencies.
- Data Integration: Ensure that data from different sources is integrated effectively to provide a comprehensive view of the business.
- Data Governance: Implement robust data governance practices to manage data assets and ensure compliance with regulatory requirements.
Tools and Technologies for Business Analytics
Several tools and technologies are commonly used in business analytics to facilitate data analysis and decision-making:
- Data Visualization Tools: Tools like Tableau, Power BI, and Qlik Sense help users create interactive visualizations that make complex data easier to understand and communicate.
- Statistical Software: Software such as R, Python, and SAS provide advanced statistical and machine learning capabilities for data analysis.
- Database Management Systems (DBMS): Systems like MySQL, PostgreSQL, and MongoDB store and manage large datasets, making them accessible for analysis.
Frequently Asked Questions
What are the key steps in analyzing sales data?
The key steps in analyzing sales data include collecting data from various sources, cleaning and organizing the data, performing statistical analysis, identifying trends and patterns, and generating actionable insights. These steps help businesses understand customer behavior, product performance, and market dynamics, enabling informed decision-making.
How can analyzing sales data help in making informed decisions?
Analyzing sales data helps in making informed decisions by providing insights into customer preferences, sales trends, and market conditions. This information can guide product development, pricing strategies, marketing efforts, and inventory management, ultimately leading to better business outcomes and increased profitability.
What tools and techniques are commonly used for analyzing sales data?
Common tools for analyzing sales data include Excel, SQL databases, and data visualization software like Tableau or Power BI. Techniques such as regression analysis, time-series forecasting, and cohort analysis are used to extract meaningful insights. These tools and techniques help in identifying patterns, predicting future trends, and making data-driven decisions.
What are the challenges in analyzing sales data and how can they be overcome?
Challenges in analyzing sales data include data quality issues, limited data integration, and lack of skilled analysts. To overcome these, businesses can implement robust data cleansing processes, use advanced integration tools, and invest in training or hiring data experts. Ensuring data security and privacy is also crucial in maintaining the integrity of sales data analysis.